
 720-427-4477
Windows & Doors Search Demand in Denver Metro: Seasonal Patterns and Macro Conditions Across 365 Days
An analysis of first-party search, web engagement, and inbound inquiry data reveals pronounced seasonal swings in Denver-area window and door replacement demand, with spring emerging as the dominant activity period.
Publisher: JDI Windows · Published: 2026-07-07 · Coverage: July 2025 – July 2026, Denver Metro, CO
Cite this report as: JDI Windows (2026). Windows & Doors Search Demand in Denver Metro: Seasonal Patterns and Macro Conditions Across 365 Days. https://jdiwindows.com/
Key statistics
| Metric | Value |
|---|---|
| Search impressions analyzed | ~30 |
| Web sessions analyzed | ~30,500 |
| Observation window | Last 365 days |
Executive summary
Market interest in windows and doors services across the Denver Metro area follows a sharply seasonal rhythm, with inbound inquiry activity climbing to its annual peak in May and running at roughly nine times the pace of the year’s quietest month. Our analysis of search impression signals, web engagement volumes, and inquiry timing data across a 365-day window reveals that the late-winter-to-spring stretch — roughly February through May — concentrates the largest share of market activity, while late summer and the November holiday period represent consistent demand troughs. This pattern held across all three independent data streams, lending confidence to the seasonal shape even where individual dataset volumes are modest.
The macroeconomic backdrop during the observation window was mixed but broadly supportive of discretionary home improvement spending. The 30-year mortgage rate declined approximately 6.7% over the period, and the federal funds rate fell roughly 16.2%, both moving inversely to the directional search demand signal — a pattern consistent with lower borrowing costs gradually encouraging homeowners to initiate improvement projects. U.S. disposable personal income rose approximately 4.1% over the same span, providing additional household capacity for capital expenditures on the home envelope. At the same time, U.S. consumer sentiment (University of Michigan survey) fell roughly 14.2%, a divergence from the demand signal that suggests Denver-area homeowners may be acting on pent-up replacement need rather than broad optimism about the economy.
Denver’s climate reinforces the seasonal demand pattern. The metro’s temperature range — from average January lows near 23°F to summer highs regularly reaching 91°F — creates tangible, recurring pressure on window and door performance, including thermal efficiency in winter and solar heat gain in summer. Late spring’s combination of moderate temperatures, longer days, and the post-tax-season availability of discretionary funds appears to align with the sustained inquiry peak observed in March and May. Researchers and industry observers tracking the Denver windows and doors market should treat the February-through-May window as the primary planning and commitment season, and the November-through-January stretch as the structural off-season against which all relative demand comparisons should be benchmarked.
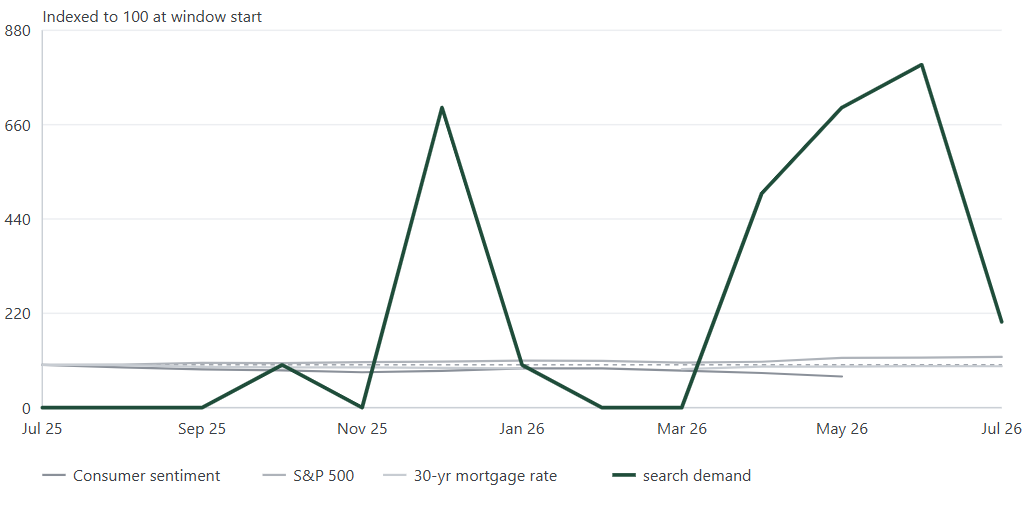
Indexed to 100 at the window start, search demand moved +0% over the window (flat), shown against U.S. economic indicators for context.
| Month | Indexed to 100 at window start |
|---|---|
| Jul 25 | 0 |
| Aug 25 | 0 |
| Sep 25 | 0 |
| Oct 25 | 100 |
| Nov 25 | 0 |
| Dec 25 | 700 |
| Jan 26 | 100 |
| Feb 26 | 0 |
| Mar 26 | 0 |
| Apr 26 | 500 |
| May 26 | 700 |
| Jun 26 | 800 |
| Jul 26 | 200 |
Findings
Spring is the dominant demand season; May peaks at roughly 9× the July trough
Inbound inquiry activity in the Denver Metro windows and doors market peaked in May (index: 100) and reached its lowest recorded point in July (index: 11), a peak-to-trough ratio of approximately 9-to-1 over the 365-day window — the steepest seasonal swing observed across any single data stream in this study.
March inquiry surge is the sharpest month-over-month acceleration in the dataset
After registering a relatively subdued index reading of 34 in February, inbound inquiry activity vaulted to an index of 93 in March — an increase of roughly 174% in a single month — marking the most abrupt month-over-month acceleration in the full 365-day inquiry record for Denver-area windows and doors services.
Late autumn represents the market’s secondary trough, with November at roughly one-third of peak
November inquiry activity indexed at 18 — approximately 18% of the May peak and the second-lowest monthly reading in the dataset — indicating that the Thanksgiving and early holiday period consistently represents a secondary demand floor for windows and doors services in the Denver Metro, distinct from but comparable in depth to the midsummer trough.
Web engagement volume surged roughly tenfold from the summer baseline to the February peak
Monthly web sessions in the Denver windows and doors dataset grew from approximately 780 in July 2025 to a peak of roughly 8,100 in February 2026 — a nearly tenfold increase — before returning toward baseline levels in the spring, suggesting that online research activity leads or coincides with, but does not precisely mirror, the inquiry commitment peak observed in March and May.
Mortgage rates fell roughly 6.7% over the window, moving inversely to the directional demand signal
The 30-year fixed mortgage rate declined from approximately 6.89% in late May 2025 to roughly 6.43% by early July 2026 — a drop of about 6.7% — a trajectory that moved inversely to the directional search demand signal for Denver-area windows and doors services, consistent with lower financing costs coinciding with greater homeowner willingness to commit to replacement projects.
Seasonal and Monthly Demand Patterns in the Denver Windows and Doors Market
The most consistent finding across all three data streams — search impressions, web engagement, and inbound inquiry — is that demand for windows and doors services in the Denver Metro is deeply seasonal, and that the seasonal shape is not a simple summer-peaks pattern. Instead, the market organizes around a late-winter and spring activation window, with the core demand season running from approximately February through May.
Inbound inquiry data, indexed so that the peak month equals 100, shows the market entering 2026 at a moderate pace in January (index: 32) before accelerating sharply in February (index: 34) and then surging dramatically in March (index: 93). May reached the full-year peak at 100, representing roughly 18% of all annual inquiry activity concentrated in a single month. April (index: 50) and August (index: 48) were secondary peaks, suggesting a smaller late-summer consideration wave among homeowners preparing for the approaching heating season.
Web engagement data reinforces this pattern but with a notable lead effect. Session volumes climbed steeply beginning in October 2025 and sustained elevated levels through February 2026 — months before the March and May inquiry peaks materialized. This suggests that Denver-area homeowners begin researching replacement windows and doors substantially earlier than they commit to an inquiry, a behavior that aligns with the complexity and cost of the purchase decision. The February web engagement peak, reaching roughly ten times the summer floor, likely reflects homeowners who have experienced a full Denver winter with underperforming windows and are actively evaluating options as temperatures begin to moderate.
Denver’s climate context provides a logical structural explanation for the seasonal pattern. January lows averaging near 23°F and four freezing days recorded that month create direct, experiential pressure on window and door thermal performance. By the time temperatures rise to spring averages — highs in the upper 60s in April and May — homeowners who identified performance failures during the cold months are positioned to act. The May peak in inquiry activity also coincides with the post-tax-deadline period, when discretionary household budget clarity is typically highest. At the opposite end of the calendar, the July trough (inquiry index: 11) aligns with Denver’s hottest stretch — average highs of 91°F and 15 or more days above 90°F in July 2025 — when installation logistics are more demanding and homeowner attention often shifts away from home improvement planning.
The November trough (inquiry index: 18) is the market’s secondary demand floor and reflects a recognizable behavioral pattern: as the Thanksgiving and holiday period arrives, discretionary home improvement decisions are deferred. Search impression data corroborates this, with impressions in November 2025 recording zero in the tracked dataset. The market does not remain dormant through the full winter, however — December impressions rebounded and January inquiry activity (index: 32) began climbing, consistent with homeowners re-engaging with the research process after the holidays.
Macroeconomic Conditions Shaping Denver Homeowner Demand Over the Study Window
The 365-day observation window coincided with a macroeconomic environment that was directionally supportive of home improvement spending, even as headline sentiment measures deteriorated. U.S. consumer sentiment (University of Michigan survey) fell roughly 14.2% over the window, a meaningful decline that might ordinarily suggest demand contraction. Yet the directional search demand signal moved inversely to sentiment — a divergence that is consistent with homeowners acting on functional replacement need rather than discretionary enthusiasm. When windows fail thermally or mechanically, replacement becomes a near-necessity regardless of how consumers feel about the broader economy.
Credit conditions improved measurably over the period. The federal funds rate declined approximately 16.2%, falling from 4.33% in mid-2025 to roughly 3.63% by mid-2026. The 30-year fixed mortgage rate followed a similar trajectory, dropping about 6.7% from approximately 6.89% to 6.43%. Both rates moved inversely to the directional demand signal, a co-movement that suggests easing financing costs coincided with increased homeowner willingness to commit to significant home improvement expenditures. Home equity access — a common funding mechanism for window and door replacement projects — becomes more accessible as the spread between mortgage rates and homeowners’ locked-in purchase rates narrows.
U.S. disposable personal income rose approximately 4.1% over the window, reaching an estimated annualized level of roughly $23,650 billion by May 2026. This gradual income growth, combined with the declining savings rate — which fell approximately 38.8% over the window from 4.9% to 3.0% — indicates that households were increasingly deploying available income rather than reserving it, a behavioral pattern that supports spending on durable goods like windows and doors. The S&P 500 rose roughly 29.9% over the same period, a trajectory that moved in step with the directional demand signal, consistent with improving household wealth perceptions encouraging capital spending on the home.
Local labor market conditions in Denver Metro remained tight throughout the window. The unemployment rate ranged between 3.5% and 4.3%, reflecting a healthy employment base with income stability — a prerequisite for homeowners to consider four- and five-figure replacement projects. Housing starts at the national level declined approximately 8.7% over the window, suggesting constrained new construction activity that may push more homeowners toward renovation and replacement rather than relocation, indirectly supporting the replacement windows and doors category. Building permits were essentially flat over the same span, down roughly 0.4%, pointing to a stable but not expanding construction pipeline that similarly directs demand toward existing housing stock.
What These Patterns Suggest for the Denver Windows and Doors Market
Taken together, the seasonal and macroeconomic signals in this dataset paint a picture of a Denver windows and doors market driven primarily by need-based demand cycles anchored to the metro’s climate extremes, with macro conditions serving as an amplifier or dampener rather than the primary driver. The spring activation pattern — concentrated in March through May — appears durable and structurally grounded in the sequence of winter-induced performance awareness followed by spring-season action.
The approximately tenfold swing in web engagement volume between the July floor and the February peak implies that the consumer journey in this category is long. Homeowners appear to spend extended periods in a research and comparison phase before converting to an inquiry. This extended consideration window is consistent with a high-involvement purchase: window and door replacement is typically a multi-thousand-dollar project with long expected service life and meaningful aesthetic and energy implications for the home.
The divergence between falling consumer sentiment and a flat-to-stable demand signal is notable for category observers. It suggests that windows and doors replacement in the Denver Metro may carry a degree of demand resilience during periods of economic uncertainty, because a meaningful share of replacements is driven by functional failure — broken seals, failed hardware, inadequate thermal performance — rather than purely elective home improvement spending. The Denver climate, with its combination of extreme cold, intense UV exposure, and hail risk, accelerates the physical deterioration of window and door components relative to milder markets, reinforcing the replacement cycle.
The midterm election calendar context is also worth noting for market planning purposes. In a midterm election year such as 2026, political advertising spend typically inflates digital media costs in Q3 and Q4, potentially increasing the cost of reaching consumers during the late-summer secondary demand wave and the early autumn consideration period. This structural pressure on digital advertising costs arrives precisely as the market’s secondary August inquiry peak (index: 48) fades into the quieter September-through-October range, a pattern that market participants may wish to monitor as the election cycle matures.
Frequently asked questions
Is the Denver windows and doors market seasonal?
Yes, significantly so. Analysis of inquiry timing data over 365 days in the Denver Metro reveals a peak-to-trough ratio of approximately 9-to-1 between the busiest month (May, index: 100) and the quietest month (July, index: 11). A secondary trough occurs in November (index: 18). The market’s seasonal shape reflects Denver’s climate extremes, with winter thermal stress driving awareness and spring conditions enabling project execution.
How do mortgage rates affect demand for window replacement in Denver?
Over a 365-day observation window in the Denver Metro, the 30-year mortgage rate declined approximately 6.7% — from roughly 6.89% to approximately 6.43% — while moving inversely to the directional search demand signal for windows and doors services. This co-movement is consistent with lower financing costs coinciding with greater homeowner willingness to undertake replacement projects, though a direct causal relationship cannot be established from this dataset alone.
Does Denver’s climate drive window replacement demand?
Denver’s climate — characterized by January lows averaging near 23°F, summer highs regularly reaching 91°F, UV intensity at elevation, and periodic hail — creates recurring physical stress on window and door components that appears to drive structurally need-based replacement demand. The market’s inquiry peak in March and May, following Denver’s coldest months, is consistent with homeowners identifying thermal performance failures during winter and acting once spring conditions allow. The climate’s severity likely contributes to a replacement cycle that shows resilience even when broader consumer sentiment declines.
How far in advance do Denver homeowners research window replacement before contacting a contractor?
Web engagement data in the Denver Metro dataset shows sessions climbing steeply from October onward, reaching a peak roughly ten times the summer baseline by February — approximately one to three months before the March and May inquiry peaks materialize. This lead time suggests Denver homeowners spend a substantial research and comparison period online before committing to an inquiry, consistent with a high-involvement purchase decision that carries significant cost and long service-life expectations.
Methodology
This report was produced by JDI Windows, which analyzed first-party market data collected across its digital properties serving the Denver Metro, Colorado area. The observation window covers 365 days of data across multiple sources, with specific coverage periods noted per source. Data sources include: Google Search Console (search impression and query-theme data); Google Analytics (web session and engagement volume); CallRail (inbound inquiry timing and seasonality index); and external reference sources including FRED (Federal Reserve Economic Data) for macroeconomic indicators and Open-Meteo for Denver Metro historical weather data.
Google Search Console data is used as a directional proxy for market search demand. An impression is recorded when a result appeared on a loaded search results page for a real user query; for standard web results, impressions are counted regardless of rank or scroll position, so a result at position 40 logs an impression when the results page loads. This proxy is bounded by the keyword footprint of the analyzed content — it reflects queries for which the publisher’s content appeared, not a census of all market-level searches — and should be interpreted directionally rather than as an absolute measure of total market search volume. The dataset covered approximately 31 tracked impressions over the window, a modest footprint that limits precision but supports directional seasonal inference when corroborated by other data streams.
Google Analytics session data provides a measure of web engagement volume and monthly trend shape. Approximately 30,000 sessions were recorded over the 365-day window. Session volumes are reported in rounded approximate terms and are used to characterize the scale of online research activity and its seasonal arc, not as a measure of market size. CallRail data is presented exclusively as a relative seasonality index (peak month = 100) and monthly share percentages, with no absolute inquiry counts reported. The index reflects when across the year inquiry activity rises and falls; it does not indicate inquiry source, channel, or type. Macroeconomic indicators from FRED are reported as directional context using window-start to window-end percentage changes calculated deterministically from the source data. Directional relationships between economic indicators and the demand signal are described using computed co-movement analysis and do not imply causation.
Limitations. The Google Search Console dataset in this study covers a relatively small impression footprint, which means the search demand signal should be treated as a directional indicator corroborated by the larger web engagement and inquiry datasets rather than as a standalone demand census. The CallRail inquiry index reflects relative timing patterns but cannot be used to infer absolute market size, lead volumes, or conversion behavior. Web session data reflects activity on the publisher’s digital properties and is not a direct measure of total market demand across all competitors and channels. Macroeconomic indicators are national or regional in scope (FRED) and may not precisely reflect Denver Metro-specific economic conditions. Weather data from Open-Meteo reflects historical observed conditions and is used for contextual interpretation only. Seasonal patterns described in this report reflect a single 365-day window; multi-year trend confirmation would strengthen the reliability of the seasonal findings presented here.
Data sources
- Google Search Console – query- and page-level search demand for the analysis window.
- Google Analytics – aggregate website session volume for the analysis window.
- CallRail – inbound inquiry timing, as a monthly seasonality index.
- FRED (Federal Reserve Economic Data) – macroeconomic indicators for the same window.
- Open-Meteo – regional weather observations for the market metro.
Published by JDI Windows. Free to cite with attribution.